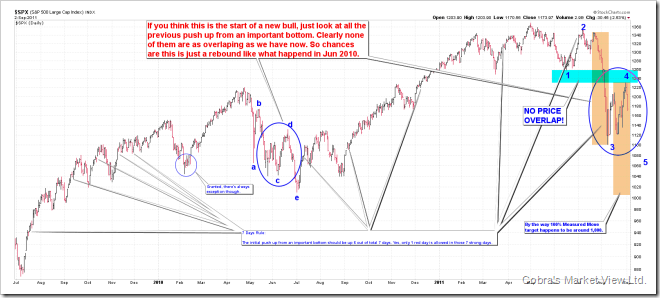
SHORT-TERM: MORE PULLBACK AHEAD
The bottom line:
- The big picture, the Friday’s pullback formed a clear overlap, so basically confirmed what we had (have) so far was (is) just a rebound, that the Aug 9 lows will be revisited. Just for now I don’t have enough evidences to prove that indeed the rebound was over.
- Short-term, likely more pullbacks ahead, SPX targeting 1140ish. Personally, I even believe the current pullback would lead us to Aug 9 lows which in another word is, I believe, the rebound was over.
The main reason for the above conclusion is the rebound clearly is weakening as A leg up was a straight 1 leg up, while C leg up, for the same magnitude, it took 2 legs to reach there. This usually imply that the pullback is strengthening, at least should be 100% Measured Move of the B leg down, therefore the calculated target could be around 1140 to 1150.
More over, I see three things in the chart below:
- The overlap is way too obvious, showing the up momentum is no match with the other rally from an important bottom in the past where there’s simply no turning back on the way up.
- If you’re experienced, it should be easy to understand that the June 2010 pullback, although obviously overlapped but even so, it’s still 3 legged down, while our current case, the magnitude is much bigger and most importantly, with no price overlap so far, so clearly a 5 wave down, therefore, I find very hard to believe that the pullback we had was just 2 legged that the Aug 9 lows is THE LOW.
- Remember the 1000, SPX intermediate-term target, I mentioned in 08/19 Market Outlook? If you consider the current rebound as a Bear Flag, then 100% Measured Move happens to be around 1000. Coincidences? We’ll see.
All the above conclusions were drawn from chart pattern which, more or less are subjective, so I’d like to present below 2 “3rd party” evidences to backup the conclusions. Not entirely cover the conclusions above, but definitely better than none.
Why likely are more pullbacks ahead? Because there were 77% chances an immediate lower low after a Major Distribution Day. We’re not far from the 100% Measured Move target mentioned above, considering usually a pullback pattern is Bear Flag first then another leg down then a real rebound is possible, while we don’t even have the Flag yet so I think to reach the 100% Measured Move target shouldn’t be a big deal.
Why was the rebound over? Because red Non Farm Payroll day usually means a turning point. Since the market rose to around Non Farm Payroll day, therefore logically the turning point this time should mean turning down.
INTERMEDIATE-TERM: SPX DOWNSIDE TARGET IS 1,000, THE CORRECTION COULD LAST 1 TO 2 MONTHS
See 08/19 Market Outlook for more details.
SEASONALITY: BULLISH TUESDAY, BEARISH SEPTEMBER
According to Stock Trader’s Almanac, day after Labor Day, Dow up 13 of last 16, 1997 up 3.4%, 1998 up 5.0%.
The below September seasonality chart is from Bespoke.
The below day to day seasonality chart for September is from Sentimentrader.
SUMMARY OF SIGNALS FOR MY PUBLIC CHART LIST:
|
||||||||||||||||||||||||||||||
|
||||||||||||||||||||||||||||||
|


