SHORT-TERM: IN WAIT AND SEE MODE
Nothing to say today, so I’ll skip today’s Trading Signals. The market is waiting for OB’s speech tonight, for now my crystal ball tells nothing about what the market’s responses will be. Purely from the chart, I see 2 things:
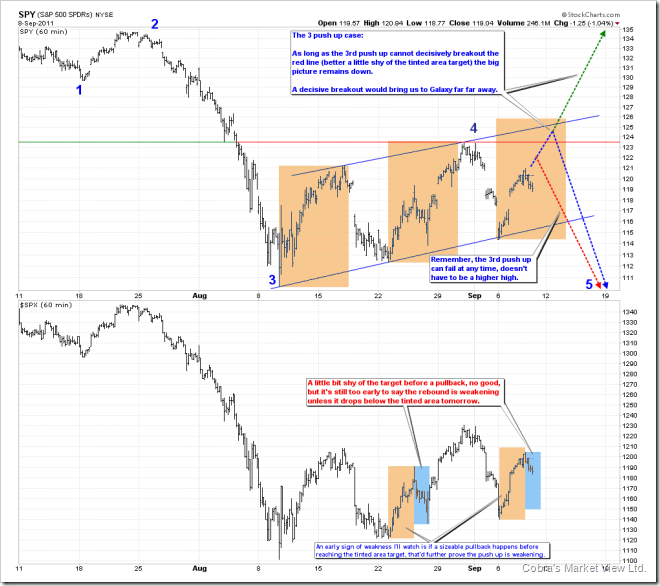
- The big picture, I’ll maintain what I said in the 09/07 Market Outlook, unless decisively breakout the Aug 31 highs, this still is a 3 push up pattern or Bear Flag. Pay attention to the red annotation below, the simplest case is to break below the tinted area tomorrow, then it would be clear that bulls are losing momentums because the rebound gets weaker and weaker, otherwise, it’s still pretty much a waiting game.
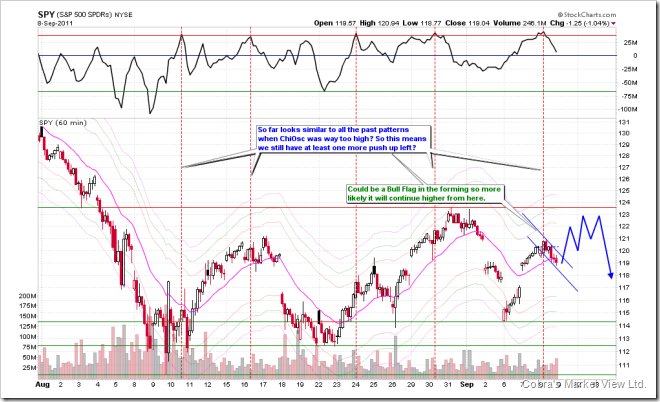
- For short-term, looks like a Bull Flag is in the forming, plus all the recent ChiOsc pattern, therefore chances are little bit higher that there’s at least one more push up tomorrow. As for why I insist that eventually the direction is down, I think I’ve explained enough in 09/02 Market Outlook and the statistics mentioned in 09/06 Market Outlook also proves it’ll drop eventually.
INTERMEDIATE-TERM: SPX DOWNSIDE TARGET IS 1,000, THE CORRECTION COULD LAST 1 TO 2 MONTHS
See 08/19 Market Outlook for more details.
SEASONALITY: BEARISH SEPTEMBER
See 09/02 Market Outlook for September seasonality.
SUMMARY OF SIGNALS FOR MY PUBLIC CHART LIST:
|
||||||||||||||||||||||||||||||
|
||||||||||||||||||||||||||||||
|


