SHORT-TERM: COULD SEE MORE REBOUND BUT MORE LIKELY THE LOW WASN’T IN YET
Still the old conclusion:
- Not sure if the rebound was over.
- Likely more selling ahead (after the rebound).
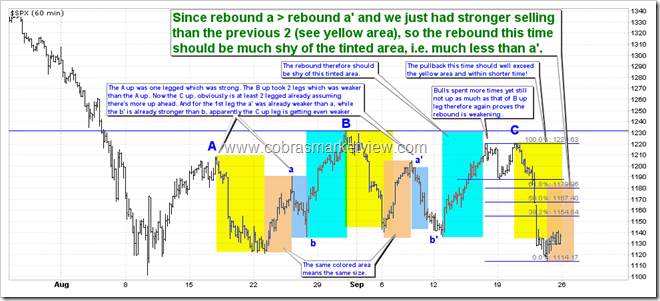
The chart below is what I’ll closely watch the next Monday. If no huge rebound instead just a consolidation around the Double Top neckline, then it’d only confirm that the breakdown is as real as it gets, therefore be prepared for the Double Top text book target being fully realized.
If however, a huge rebound starting from the next Monday, because the 2nd previous rebound was weaker than the 1st previous rebound while the 3 pullbacks increased each time, so chances are the 3rd rebound would be much weaker than the previous 2, therefore my guess is the rebound this time won’t exceed 1180 (Fib 61.8%), more likely ends around 1170 (Fib 50%) .
The chart below explains why I’ve been insisting that there’ll be a 3rd leg down (aka, break below the Aug 9 lows), and why the the 3rd leg down target is around 1080.
- Because of the law of inertia, historically, all large scale corrections (on the chart I use 14% ZigZag, but it doesn’t mean the correction has to be larger than it, I just mean big correction) were 3 legged.
- In the May 2010 correction, the 1st down leg and the 3rd down leg were obviously overlapping, therefore it’s merely an ABC corrective wave down, but even so, it’s still 3 legged. Now we have a much bigger correction and so far without overlap, therefore I find it very hard to imagine that the correction is just 2 legged.
- As for why the 3rd down leg target is around 1080, the chart should be clear, because usually the 3rd leg low is just a little lower than the 2nd leg low, so I believe the Fib 61.8% of the Measured Move of the 2nd down leg is more logical which is around 1080ish.
As for the 3rd party evidences to support the above pattern analysis (proving that more rebound maybe but more likely the selling isn’t over yet), I’ve listed most of them in the 09/22 Market Outlook, so to save the image server spaces, in this post, I’ll simply give a list below, you can click the link to see all the charts in my public chart list.
- 6.3.2d Major Distribution Day Watch (LL Guaranteed), in most cases, there were lower low after a Major Distribution Day.
- 6.3.2b Major Distribution Day Watch, 2 Major Distribution Days within 5 days means rebound (maybe) but more selling ahead.
- 6.4.2c Extremely Low TICK MA3 Readings Watch, very low TICK MA(3) means rebound but more selling ahead.
- 8.3.6a SPY Daily Bar Completely Below BB Bottom – 1993 to 8.3.6j SPY Daily Bar Completely Below BB Bottom – 2011, SPY daily bar completely below BB bottom mostly was not the bottom.
- 8.3.7a VIX Body Completely Out Of BB Top – 2004 to 8.3.7f VIX Body Completely Out Of BB Top – 2011, this is a new evidence, although there’re a few cases were exactly the bottom, but mostly, after a rebound (may or may not), the selling continues (22 out of 28 times).
In addition, there’re 3 charts I’d like your attention:
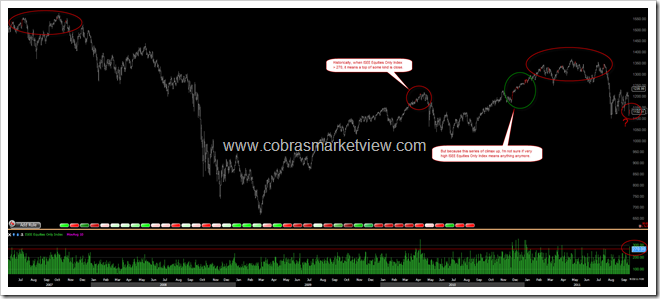
As mentioned in Friday’s Trading Signals, the ISEE Equities Only Index is way too high (larger than 270) which in the past meant a top of some kind until the end of year 2010. So I’m not sure whether this time the reading means 2010 year end kind of rally once more or the more conventional top sign. From all the evidences so far I’ve gathered, chances are a little higher that it’s a top sign this time though.
In 09/22 Market Outlook, I mentioned the positive divergence between NYA and NYMO, so the market has met the very basic bottom condition. However, there’s still no Positive Divergence between SPX and NYMO which from the chart below, seems such a Positive Divergence is necessary as well.
In 09/22 Market Outlook, I mentioned the Hindenburg Omen, but it’s not correct because the NYA weekly MA(10) is pointing down now.
INTERMEDIATE-TERM: SPX DOWNSIDE TARGET IS 1,000, THE CORRECTION COULD LAST 1 TO 2 MONTHS
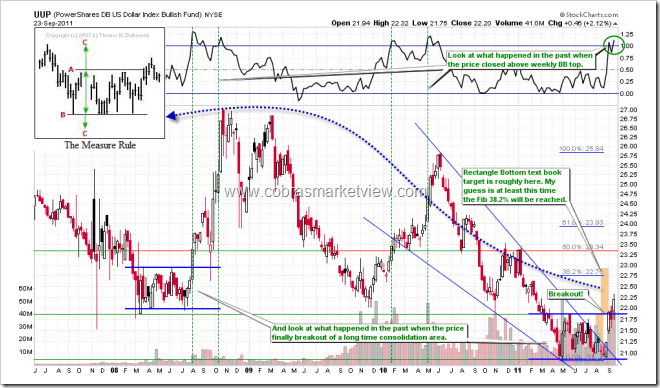
For the intermediate-term, I’ll maintain the forecast that the correction is most likely to touch the SPX monthly BB bottom which now is around 1,003, see 08/19 Market Outlook for details. According to UUP Rectangle Bottom text book target, SPX 1,000 still looks very possible.
SEASONALITY: BEARISH FRIDAY
According Stock Trader’s Almanac, last day of Q3, Dow down 9 of last 13, massive 4.7% rally in 2008.
See 09/02 Market Outlook for September seasonality.
SUMMARY OF SIGNALS FOR MY PUBLIC CHART LIST:
|
||||||||||||||||||||||||||||||
|
||||||||||||||||||||||||||||||
|


