SHORT-TERM: IN WAIT AND SEE MODE
No conclusion today, let’s see tomorrow.
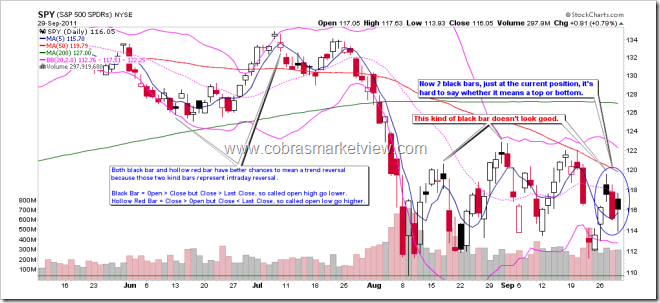
The chart below should explain what I saw. Sharp rebound again on the 3rd touch of the same line, the question is: Will the 3rd time be the charm? How the market moves in the follow several trading days will probably give us some clue about bull or bear to be.
One thing I’d like you to know ahead is, if cannot up huge tomorrow, then starting from the next week, bears would have one extra insurance, well, statistically. I’ll present my witness in the weekend report. In summary, 75% chances the next week will drop below today’s low and the next few weeks and even longer time would be bears safe zone. Again, pay attention to the pre-condition which is no huge up tomorrow, such as another 20 points gap up and then another 30 points up thereafter, something like that. Frankly, I’m really scared by bulls. If indeed up huge tomorrow, then bears safe zone will have to wait until the next next week, in which case, I’ll present my witness the next next week. All in all, my evil intension is to make sure you always want to come back to read my report. LOL.
Chart pattern wise, it’s hard to say today’s black bar means top or bottom, so again, need see tomorrow.
If you really really want my wild-est-est-est guess about tomorrow, I’d say, a little little little little bearish biased. There’re 2 reasons, except that according Stock Trader’s Almanac, last day of Q3, Dow down 9 of last 13. Neither of those 2 reasons are solid, so that’s why I say a little little little little bearish biased:
Three reversal like bars on the IBM daily chart, so IBM could be topped. The stock weights 12.20% in INDU, so if this guy indeed drops, then INDU won’t be good.
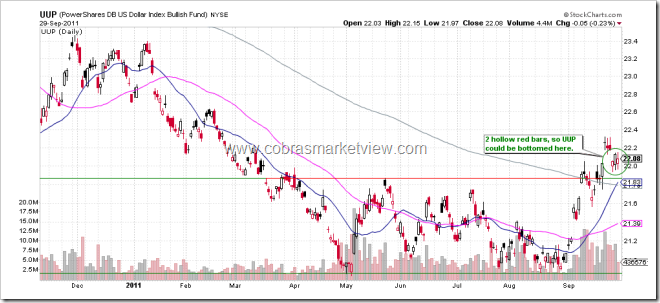
Unlike SPY black bars which looks ambiguous, the 2 hollow red bars on UUP daily chart looks like a bottom of some kind, so if the dollar up, then the overall stock market won’t be good.
INTERMEDIATE-TERM: SPX DOWNSIDE TARGET IS 1,000, THE CORRECTION COULD LAST 1 TO 2 MONTHS
See 08/19 Market Outlook for details.
SEASONALITY: BEARISH FRIDAY
According Stock Trader’s Almanac, last day of Q3, Dow down 9 of last 13, massive 4.7% rally in 2008.
See 09/02 Market Outlook for September seasonality.
SUMMARY OF SIGNALS FOR MY PUBLIC CHART LIST:
|
||||||||||||||||||||||||||||||
|
||||||||||||||||||||||||||||||
|


