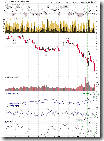
I must admit that my prediction was wrong, the market does care the deal. Although the market is extremely oversold, I am not sure if this means the market would bounce back tomorrow. Under the current situation, it doesn't make much sense to say "stay clam" ... "stay defensive", etc. Everyone should have a plan in their mind, what to do if the market bounces back, and what else to do if the selling off continues. At the moment my long positions are not very heavy, and I also think that a oversold market could have a chance to bounce back, therefore I decide to hold my positions. Depending on how the market goes I will think about whether or not to do bottom fishing, but I will not be aggressive for sure.
During the trading hours a friend said -- Don't bet on the end of the world -- I think it makes sense at the time being.
From the perspective of technical analysis, the market is deeply oversold. I do not know if you still believe in the oversold indicators, but I list them as follows anyway. Probably it is the time to believe in the government.
2.4.3 Breadth Oversold/Overbought Watch. RHNYA is almost zero, extremely oversold. NYA50R is also oversold. Although it has not reached the July low, it will probably get there after one more day's selling off.
1.3.7 Russell 3000 Dominant Price-Volume Relationships. The dominant price-volume relationships today are 2183 stocks price down volume up, which indicates the market is oversold. According to the chart, every time after the price down volume up, the market bounces up nicely on the next day. Hopefully tomorrow is not an exception.
2.0.0 Volatility Index (Daily). Several indicators are overbought. On the other hand, this chart reveals that today's low may not be the bottom. As I mentioned in the past, usually the bottom is formed as an intraday reversal, so the market is not likely bottomed out while the VIX is still a big while candle.
1.1.6 QQQQ Short-term Trading Signals. Note that in the past NAADV bounced back while the blue line reaches today's level twice.
1.1.7 TRINQ Trading Setup. TRINQ is much higher than 2.0, so QQQQ might bounce back. So far the success rate of this setup is 75%.
1.0.3 S&P 500 SPDRs (SPY 60 min), 1.1.4 PowerShares QQQ Trust (QQQQ 60 min), 1.2.3 Diamonds (DIA 60 min). Look at how oversold the RSI is. If you think it is not oversold enough, it will be after one more down.
1.4.4 TSE McClellan Oscillator. New low spikes on the Canadian market, which is an early sign of bottoming. 1.4.2 S&P/TSX Composite Index (60 min), RSI on the 60-min chart is also oversold. By the way, on US market the new low spikes as well (refer to 2.4.4 NYSE McClellan Oscillator), however it doesn't go beyond the level on 17th so I don't show it here.
1.0.6 S&P 500 Bullish Percent Index. Today it gives a mid-term sell signal, and the signal are confirmed by all three major indices, very bearish. 0.0.0 Signal Watch and Daily Highlights shows the status of all signals. No comments at the moment, wait for the smoke to clear firstly.


1 Comment