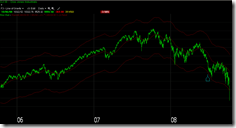
Tonight, I want to share with you a chart called "Line of Gravity" invented by a WS genius (I cannot spell his name, sorry). It's basically 10% envelope of ( EMA30 + EMA72 ) / 2 for INDU only.
A very basic theory about this "Line of Gravity" chart is if the price drops out of the envelope, it will rally back and such kind of chances (of being dropped out of the envelope) are very rare and therefore it's "once in a life time chance" (sorry, I cannot think of a right English word for this. By the way, the market summary you see everyday is actually translated from my Chinese summary by my friend. I myself is too busy to do the translation.)
OK, chart says everything. Let's look at all the history charts for the "once in a life time chance". And of course YMYD. Cheers!
Oh, my daily summary was ready and my friend is now busy translating it, so stay toned.


