No comments to the mid-term trend today since we have not seen any big pullback to challenge the previous conclusion. Over the short term, tomorrow or the next week the market might pull back. Therefore it is better not to chase should the market rally tomorrow.
0.0.2 SPY Short-term Trading Signals. The recent two candles are quite bearish, bearish shooting star and bearish hanging man, so pullback may happen tomorrow. In addition, SPX has never gone up for 2 days in a row in October, and tomorrow is the last chance. Let's see if the pattern of single day rally in October can be broken tomorrow. Furthermore, today is an inside day, which means the second day might be a drop according to the statistics by a reader. Although I do not think this evidence is strong enough, the chart does show it.
1.0.3 S&P 500 SPDRs (SPY 60 min). Today RSI didn't break the resistance.
1.1.0 Nasdaq Composite (Daily), 1.3.0 Russell 2000 iShares (IWM Daily). In the three days of rally, the volume is decreasing. As mentioned earlier, this pattern has a high probability of pullback.
1.1.3 PowerShares QQQ Trust (QQQQ Daily). STO hits the record resistance level on the chart. So the probability of pullback is high.
1.3.7 Russell 3000 Dominant Price-Volume Relationships. Today 1789 stocks were price up volume down, which is the most bearish one among four price-volume relationships. The statistics shows that, tomorrow or as late as the next Monday the market will pull back.
2.4.4 NYSE McClellan Oscillator. NYMO is too close to overbought level, and this clearly tell us why it is not a good idea to chase the rally tomorrow.
2.8.1 CBOE Options Total Put/Call Ratio. CPC has been lower than 0.8 for two days, which is too bullish to be good.
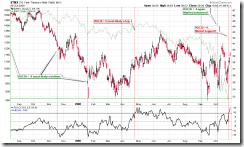
3.0.0 10Y T-Bill Yield. Usually this chart says the market is at a top. Just for your information, no further comments. The past history of this indicator is shown on 8.0.4 Market top/bottom by ROC30 of 10Y T-Bill Yield 2005-2008 to 8.0.5 Market top/bottom by ROC30 of 10Y T-Bill Yield 2001-2004. The conclusion is that the timing for market bottom is accurate, but timing for top can be one month earlier.
3.0.2 TED Spread. FYI only, I don't have a concrete conclusion. It is good that LIBOR is falling, but 3 month T-bill Yield is also falling, I don't know whether this means the further rate cut or big moneys are short of fund.
1.4.3 S&P/TSX Composite Index (15 min), MACD and RSI show negative divergence, so Canadian market will likely pull back.


1 Comment