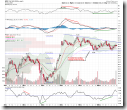
Today not much to talk about, it's just a consolidation before the catalyst upside breakout or falling down to hell. However, the final result is unknown at the moment. On the chart, either bulls or bears can find signals favors them, but bulls' signals are more short term, so I guess the market could go up tomorrow morning.
0.0.2 SPY Short-term Trading Signals. As said yesterday, this is a typical consolidation, and the small candle can extend further until it breaks out at one direction. Note the bottom of the chart, NYMO is still overbought which is good news for bears.
1.3.7 Russell 3000 Dominant Price-Volume Relationships, 1665 stocks price up volume down, very bearish, and this is also good news for bears.
3.2.3 US Dollar/Japanese Yen Ratio. This is my biggest concern. Yen is becoming stronger with respect to US dollar and Euro, and this is bearish to the stock market.
1.0.3 S&P 500 SPDRs (SPY 30 min). Take a look at the support level, which still hold, good. If it gets tested the third time, however, the chance of being hold is close to zero. The positive divergence on the chart favors bulls.
1.0.4 S&P 500 SPDRs (SPY 15 min). MACD, RSI and ChiOsc are all positive divergence, so the possibility of rally in the near term is relatively higher.
5.3.0 Financials Select Sector SPDR (XLF Daily). You may notice that Financials are quite weak. The chart is roughly a test back after the breakout. Furthermore, two down days couldn't even claim the gain in two previous up days, which is not so bad.
1.4.3 S&P/TSX Composite Index (15 min). Canadian market doesn't look so good. Bearish rising wedge, MACD and RSI show negative divergence on the daily chart. 1.4.0 S&P/TSX Composite Index (Daily), four days of up trend failed to compete the previous four days of down trend, very bearish.


6 Comments