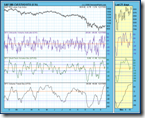
Today is a consolidation day, and the direction is undecided. There is no technical indicator to predict whether the market will go up or down tomorrow. I guess the correction could continue in the morning but finally the market would close in green. The reason is that there has been no two consecutive down days since December. In term of operation, because the short-term breadth signals are a bit overbought or nearly overbought, it's better to lock the profit should the market rally substantially.
Over the intermediate term, my signals are based on 0.0.3 SPX Intermediate-term Trading Signals. Since it's all buy signals and no obvious negative divergence, so the strategy is to buy dip according to 8.1.1 Buyable Pullback Rule. In the short term, do not consider to short unless you are very sure, for instance, there were several accurate signals yesterday, and the short positions should be hold for hedge the intermediate term long positions because the mid-term signals are often time-delayed, as soon as the signals are confirmed much profit has gone already.
0.0.2 SPY Short-term Trading Signals. It's very likely an ascending triangle, and the upper edge has been tested six times, and I guess the breakout will be at the up side. Note the two short term overbought signals, VIX ENV may not mean anything, but NYMO is fairly accurate. Of course it is not very high today, but it will be if the market rallies further.
The T2122 of Telechart, NYSE 4 week New High / Low Ratio, is a bit high. If it reaches the blue line at the top, the probability of short-term pullback is quite high.
Here is the SPX Cimactic Volume Indicator (CVI) chart. If the market rallies it may go back to overbought region.
Some readers reminded me yesterday that, major accumulation day on 1.0.5 Major Accumulation/Distribution Days, break down symmetrical triangle on 2.0.0 Volatility Index (Daily), and major indices closed above 50-day moving averages for the first time, which are all bullish signs. I didn't mentioned those because they didn't reflect the major signals during the day. Today there are several other interesting charts, 3.0.3 20 Year Treasury Bond Fund iShares (TLT Daily), overbought, 3.1.0 US Dollar Index (Daily), oversold, 3.2.0 CurrencyShares Japanese Yen Trust (FXY Daily), overbought (it may not be an important signal later as mentioned yesterday); 3.2.3 US Dollar/Japanese Yen Ratio, this shows that it's no longer valid to use Yen to predict the direction of the stock market.


1 Comment