An inside bar again, three days in a row, indecision and emotion accumulation, the breakout will be violent either up or down. Well, I wish I could know the direction, although based on a few straws I've collected from my chart book, the guess is UP.
1.0.8 Extreme CPC Readings Watch, unlike the common believes, extremely low CPC readings are generally bullish. Only the ACCUMULATION of extremely low CPC readings are bearish and by the way, that's why I use "normalized CPC" in chart 2.8.1 CBOE Options Total Put/Call Ratio to help me identifying the possible top and bottom.
1.1.4 Nasdaq 100 Index Intermediate-term Trading Signals, green dashed lines, it seems that every time NAUPV crossover above NAADV, the market is in for a good bounce. Well, let's don't discuss how illogic it is to use NAUPV and NAADV crossover, please. I said in article here Does INDU lead market?, I don't care how illogic something may sound, I read only charts.
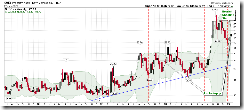
2.0.1 Volatility Index (Weekly), looks topped to me, may pullback and therefore is good for the overall market.
3.1.1 US Dollar Index (Weekly), looks topped too, a Doji. The pullback of $ is good for commodities which may help lift the overall market.
Oh, one more chart about Dow Theory: 1.2.1 Dow Theory: Averages Must Confirm, it's very interesting that the recent TRAN new low wasn't confirmed by INDU. let's see how things going.


5 Comments