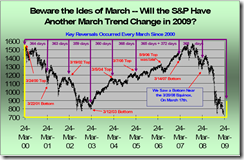
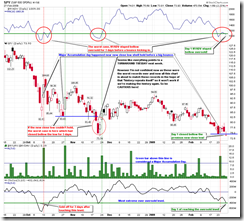
TA is based on the assumption that the history repeats itself. However, at the time being there is not much history to look for the repeated pattern for the market, what we can refer to are only the market conditions in last October and November. Therefore, we will compare the current situation with that time and see if the market could bounce back up in the short term. If the last October/November pattern repeats, the next Tuesday might be a reversal day, however don't count on it. If we are witnessing a new chapter in the history, no analysis will work. The bottom line is, there is no bottoming sign on 0.0.1 Market Top/Bottom Watch, and any rebound is a short opportunity.
Firstly let's check out the potential target and time frame of this round of sell off.
0.0.3 SPX Intermediate-term Trading Signals. The breakdown on Friday means the confirmation of Flag or Pennant Pattern in the Thursday report, and this pattern often means the trend is on its half way. Based on this theory, the potential target of SPX is about 647. By the way, we will discuss NYADV (blue curve) and ChiOsc on 0.0.3 later, and they are the main evidence for Tuesday reversal. Here you have an impression first, these two indicators are at extreme levels.
1.0.2 S&P 500 Large Cap Index (Monthly). On the monthly chart, 647 is at about Fib 61.8 and it looks close to a support. Of course, a real support is around 400.
When will this sell off come to an end? https://www.technicalindicatorindex.com provides a very interesting chart and claims that March 20th is likely a reversal. After that, based on my experience, the market will rally into May should "Sell in May" still works.
OK, now let's check out the short-term charts and see how possible the rebound will be. Again, don't count on it.
The following chart is today's focus. In last October and November, the worst situation is that three indicators stay under oversold level for three days, suppose last Friday is the day 1, then Tuesday could be a reversal (may not close in green though), and rally comes into play on Wednesday. Once again, the major accumulation day must be the first one after the new close low which is marked in dashed line, other major accumulation days don't count.
1.3.7 Russell 3000 Dominant Price-Volume Relationships. 1155 stocks price down volume up, although it means the market is oversold, I don't think this is sufficient for a rebound.
2.3.4 Nasdaq Total Volume/NYSE Total Volume. Here it looks like a short-term bottom. The nearest scenario is signal came out on Friday, further down on Monday, and rebound on Tuesday. Well, again it points to Tuesday. By the way, there is a statistics called "turnaround Tuesday", and Monday has higher probability of going down.
1.1.6 PowerShares QQQ Trust (QQQQ 15 min). The ChiOsc at the bottom of the chart is way too low, while STO is not at bottom yet. Therefore, QQQQ may go down further on Monday with a small rebound during the day.
3.4.1 United States Oil Fund, LP (USO Daily). The oil meets resistance, period.
Almost forget this 0.0.4 SPX:CPCE, the firework setup is still valid, however I don't think it will happen. Buy signal on MACD is likely a whipsaw, and we will know on Monday.


9 Comments