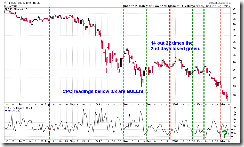
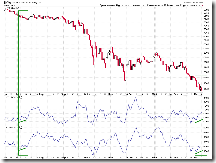
CPC dropped bellow 0.8 again today, so a firework is coming? I suspect that this is a speculation play related to the Thursday's Mark-to-Market meeting. My firework prediction according to CPC < 0.8 in 02/24/2009 Market Recap: A CPC's Tale has turned out to be wrong, but on 2/25 and 2/26 the market did attempt a firework, just couldn't hold on, so the rule about "when CPC < 0.8, there'll be a firework" may still apply this time, therefore bears should be careful here especially now the market is very oversold. Tomorrow, also because of CPC < 0.8, 14 out 22 times the market may close in green. Intermediate-term, lots of bullish signs as well as some bearish signs, so no solid conclusion, I'll list all these signs in today's report for your references. My guess is, a short-term rebound is due, but intermediate-term still hasn't bottomed.
Short-term:
7.0.4 Extreme CPC Readings Watch, CPC < 0.8, 14 out 22 times, the next day, SPY closed green.
1.0.4 S&P 500 SPDRs (SPY 15 min), Bullish Falling Wedge plus an oversold STO, so a rebound could be tomorrow.
Intermediate-term:
Bullish signs:
0.0.3 SPX Intermediate-term Trading Signals, RSI, STO and ChiOsc are all very oversold, VIX:VXV is very close to the buy area, and the most important is that the NYUPV in red leads the NYADV in blue (volume leads price) on the upside while the SPX is down, this is a positive divergence.
The following chart explains why the positive divergence of NYUPV and NYADV is important. The same positive divergence was formed before the market bottom in last July.
1.1.0 Nasdaq Composite (Daily), Dow Theory, a sell signal is confirmed only when both $INDU and $TRAN has reached a new low. From Nasdaq point of view, $SOX vs $COMPA is equivalent to $TRAN vs $INCU. Now $COMPQ has formed a new low but $SOX is far away from confirming it, this is a bullish sign.
2.3.4 Nasdaq Total Volume/NYSE Total Volume, the normalized value bellow says that the market is bottoming.
T2101 from Telechart, no need to know what T2101 represents, just pay attention to the relationships between the brown curve and the blue curve which represents SPX. It looks that whenever brown curve turns so does the blue curve. Now brown curve turns again, does this mean that SPX is about turning higher?
Bearish signs:
2.8.1 CBOE Options Total Put/Call Ratio, the normalized CPC at bottom is still bellow zero line. I've checked all the available record in www.StockCharts.com, there wasn't a single instance that the market was bottomed when the normalized CPC was bellow zero line. So if history repeats itself, according to the current normalized CPC position, it's impossible for the market to be bottomed.
1.1.7 QQQQ Outperforms SPY Good Sign?, the ratio is too high, I really don't know how Mr market is going to handle this, if right from here an intermediate-term rally begins.
The conclusion, this down leg may take much longer time to complete, therefore there'll be a or even several short-term rally among the entire process. The bottom line still is "no panic no bottom", but bears must be prepared for a sudden rally, so even if it turns out to be that "this time IS DIFFERENT", an intermediate-term rally can be formed without a panic selling, bears won't suffer too much.


7 Comments