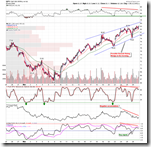
Three points for your information. The well expected meaningful pullback might be approaching, and it’s time for bulls to lock the profit and for bears to be patient.
- Note the normalized CPC at the bottom of 2.8.1 CBOE Options Total Put/Call Ratio is starting to rise. Declining CPC has successfully predicted the recent rally, will the rising CPC forecast the pullback of the market?

- 5.0.1 Select Sector SPDRs Financials sector has led the rally but it starts to lag behind. Moreover, energy sector is also lagging behind. The lag of these two sectors with the heaviest weights in the index may be a warning to the market.

- 1.0.3 S&P 500 SPDRs (SPY 30 min). The negative divergence becomes more serious which is sign of weakening momentum of this rally. It is more clear to check the A/D for the negative divergence on ChiOsc, so I temporarily replaced ChiOsc with A/D.

2.8.0 CBOE Options Equity Put/Call Ratio starts to test the double confirming trend line today. The trend line is not broken yet. However, it won’t be intact should the market drops down tomorrow.
As we talk about for several days, the market is more or less overbought in both short and intermediate term. Let’s check out more details.
0.0.2 SPY Short-term Trading Signals. RHNYA at the very bottom of the chart is 100%, which means there is no new 52 week low today. Such a value can only be found in 2003 when the market had rallied for a while, while now the rally has only lasted for 14 days.
1.1.4 Nasdaq 100 Index Intermediate-term Trading Signals. NDXA50R at the bottom of the chart is way too high which is at the big bull market level. Note that NAADV and NAUPV starts to separate, and usually index starts to fall after NAUPV. The separation between NYADV and NYUPV can also be seen on 0.0.3 SPX Intermediate-term Trading Signals.
T2122 from Telechart, 4 week New High/Low Ratio, is way too high.


19 Comments