| Trend | Momentum | Comments - Sample for using the trend table. Warning: This is NOT a trading recommendation! | |
| Long-term | Down | Idea for trading intermediate-term under primary down trend. | |
| Intermediate | Up | Overbought | Hold long. |
| Short-term | Up | Overbought | May need take profits. |
| Report Focused On | Buyable dip or the market topped? |
| Today’s Summary | Market overbought, expect a pullback. Bears, be prepared for the rally to reach MA200 on SPX chart. |
When you drive to a shopping mall you may notice that occasionally it’s possible to find a spot very close to the entry even when it’s very crowded, however many times you are not so lucky. TA signals are similar. Sometimes they don’t work but nevertheless that stands for high probability. In other words, TA signals may always tell you do not try to find a spot near the entry of a shopping mall when it’s crowded. Now the market is overbought again, and the previous overbought didn’t work well, what about this time then? Are we lucky enough to find a closest parking sport near the mall entry again?
0.0.2 SPY Short-term Trading Signals.
1.1.4 Nasdaq 100 Index Intermediate-term Trading Signals. Especially the NDXA50R at the bottom which is at a bull market level.
1.1.6 PowerShares QQQ Trust (QQQQ 15 min). The pattern seems like a bearish rising wedge, and there are some negative divergences in place.
1.3.7 Russell 3000 Dominant Price-Volume Relationships. 1595 stocks price up volume down is significant. Twice of price up volume down in a row is clearly a warning.
2.8.0 CBOE Options Equity Put/Call Ratio. Watch for the further rise.
3.1.1 PowerShares DB US Dollar Index Bullish Fund (UUP 30 min), ChiOsc is too low so US dollar may rebound and that will be bearish to the stock market.
T2103 from Telechart.
T2122 from Telechart.
5.3.0 Financials Select Sector SPDR (XLF Daily). This is a good news. I don’t think XLF has broken out on Friday, however the pattern looks like an Ascending Triangle and XLF may go further up. On the other hand McClellan Oscillator of XLF is a bit overbought and this indicator is quite accurate.
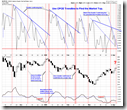
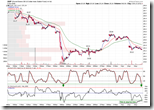
I notice that bears, especially bears in my blog, tend to short the market all the way up. I don’t believe this rally and I do have some signals indicating a potential market top over the intermediate term. But let’s face it, even my “disbelieve” is correct, the market usually tends to be irrational far longer than one could ever imagine. The following two charts compare the bear market in 2000 and the present situation.
- Very often the bear market rally lasts 4 to 5 weeks without a meaningful pullback. So looks like now is the first typical bear market rally since 2007.
- The target of the bear market rally is usually MA 200 (i.e. weekly MA40). Now we are only half way, aren’t we?
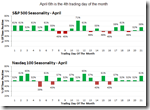
- In term of seasonality (Courtesy of www.sentimentrader.com), April is one of the most bullish months in a year. Do you remember the big rally in the last April?

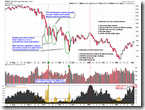
- Institution is still in accumulation mode (Courtesy of www.stocktiming.com). Although there might be a little bit negative divergence, at least the accumulation is still stronger than the distribution, right?

Now let’s take a look at two important intermediate-term topping signals.
0.0.1 Market Top/Bottom Watch. NYA50R is very close but not there yet.
Smart Money / Dumb Money Confidence from www.sentimentrader.com. Not there yet, isn’t it?
The conclusion is that, bears are better not to be too aggressive before the trend is weakening and confirmed by N vs N rule.


16 Comments