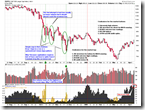
| Trend | Momentum | Comments - Sample for using the trend table. Warning: This is NOT a trading recommendation! | |
| Long-term | Down | Idea for trading intermediate-term under primary down trend. | |
| Intermediate | Up | Neutral | Beware of $NYA50R which usually means a top |
| Short-term | Up* | Neutral to overbought | Take profit especially if further up next Monday. |
| Report Focused On | Buyable dip or the market topped? |
| Today’s Summary | Expect a short-term pullback or even a down week next week. Top might be a few weeks away but please let the market go first. |
7.1.0 Use n vs n Rule to Identify a Trend Change, higher high, and bulls won again, therefore the uptrend is strong. However, the market is a bit overbought in the short-term. Be ready to take profit especially if the market goes up further on next Monday.
Let’s see how overbought the market is in the short term.
T2122 from Telechart, 4 Weeks New High/Low Ratio, you may have seen it several times and should have no doubt about its accuracy while it’s overbought.
5.3.1 Financials Select Sector SPDR (XLF 30 min). This is too much and I believe a pullback is due on Monday. 5.3.0 Financials Select Sector SPDR (XLF Daily), also expect further rally after the pullback, and the target is about $11.58.
3.4.2 United States Oil Fund, LP (USO 30 min). Bearish rising wedge, and the crude oil may possibly pullback and thus affect the energy sector. Since energy and financials have the greatest weights in the market, the entire market may drop down should these two sectors pullback.
2.0.0 Volatility Index (Daily). STO is too low and VIX may bounce back up, this is no good to the stock market.
1.1.4 Nasdaq 100 Index Intermediate-term Trading Signals, I almost show this chart everyday. If you believe iPod preserves value better than gold, go ahead.
1.0.2 S&P 500 SPDRs (SPY 60 min). Many negative divergence gives a hint of possible pullback. Note that there are 4 unfilled 1% or greater gaps, so I really doubt if any further open gap can hold. In other words, probably any gap up is an opportunity for short-term short sell.
OK, let’s see how the market goes over the intermediate term.
Here is the chart in 2000 bear market. What did it happen after 5 weeks of rally with price-volume negative divergence? I am not saying this time the market will repeat the history exactly, I just point out that 5 up weeks does not means a bull market. Furthermore, after several weeks of rally while the volume decreases continuously, very likely we will see a negative week.
1.0.0 S&P 500 Large Cap Index (Weekly). Note the negative divergence on the volume supports a down week with high probability. Also notice the STO on the top of the chart is at such an overbought level which is rare even in a bull market. The last overbought comparable to current one is in last April, the market turned south 3 weeks later. I guess the history may repeat because of sell in May, and May is precisely 3 weeks away.
2.0.1 Volatility Index (Weekly). Again, STO on VIX may also take 3 weeks to reach the red line, and this level is often the top of the market even in a bull market.
0.0.1 Market Top/Bottom Watch. The current level of NYA50R is used to be the intermediate term top in the past.
Indicators at extremes from www.sentimetrader.com. This a sum of all bullish and bearish signals at extreme level from sentimentrader. So many signals are over bullish and I cannot list all of them here. The chart is actually simple, notice Net % at Extreme at the bottom, when the difference between too bullish and too bearish signals is huge, in other words when the blue curve is very high, the market is usually topped out. Now the blue curve is very high and risky at this time, probably there could be one more push.
The bottom line, note NET Institutional Buying and Selling is very important, and I truly believe that something is seriously wrong. However, like the analysis above, maybe the market could go up further, so we don’t need to guess where the top is, just let the market go first. My secret weapon, during the following period of time, will be 2.8.0 CBOE Options Equity Put/Call Ratio and n vs n rule. Until then!


13 Comments