Summary:
Maintain "down" view on the intermediate-term but better wait until SPX 878 broken before taking further actions.
Expect a pullback tomorrow.
| Trend | Momentum | Comments - Sample for using the trend table. | |
| Long-term | Down | Idea for trading intermediate-term under primary down trend. | |
| Intermediate | Down | Neutral | |
| Short-term | Up* | Neutral |
A Bullish Engulf pattern was formed today which looks bullish. Although the volume seemed a little low comparing with the relative bigger rising rang but since I’ve seen so many cases continuing up on decreased volume, so I don’t think it’s the reason to be bearish. Because no sell signals are changed in chart 0.0.3 SPX Intermediate-term Trading Signals, so, no argue with signals, maintain the “down” view on the intermediate-term. If you plan to follow the intermediate-term sell signal but have yet started, suggest to wait until SPX 878 is broken in case all the sell signals given by chart 0.0.3 are whipsaws. If you’ve already started shorting then don’t average down now, wait to see if the market could follow though the today’s Bullish Engulf pattern. Tomorrow, because very short-term is very overbought, so I expect a pullback and eventually a red close.
2.8.0 SPX:CPCE, this is the main reason for expecting a pullback tomorrow: CPCE is way too bullish and every time it’s this bullish the next day wasn’t very pleasant.
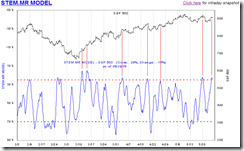
Short-term model from www.sentimentrader.com, overbought. This model works pretty well recently so I consider it as another reason for expecting a pullback tomorrow.
From seasonality however, as reported in the weekend' report, tomorrow is the 2nd most bullish day in May. Also it’s a very common pattern that a big price bar (such as today) is followed by a small price bar (for consolidation purpose). So a reasonable guess for tomorrow is a small red price bar or a Doji bar.
The follow are for your reference only as I’m trying to add the “cycle” analysis into my daily report gradually.
1.0.2 S&P 500 SPDRs (SPY 60 min), the 7 trading day cycle and 13 trading day cycle are very interesting (For bigger picture please see 7.6.1 SPX Cycle Watch (60 min)). Today happens to be the end of the 13 trading day cycle which was usually a turning point in the past. So does this mean a turning point tomorrow? Well, let’s wait and see.
7.6.0 SPX Cycle Watch (Daily), 3 interesting cycles on the daily chart. By the way, the March bottom happens to be the joint point for all these 3 cycles and that could be the reason why the rally we’ve seen is so powerful. LOL


24 Comments