Summary:
Still overbought with some not so good signs so better not to bet heavily on the long side.
| Trend | Momentum | Comments - Sample for using the trend table. | |
| Long-term | Down | Idea for trading intermediate-term under primary down trend. | |
| Intermediate | Up | Overbought* | Some buy signals still need further confirmation. |
| Short-term | Up | Overbought |
Yes, the intermediate-term is on the BUY, but a pullback is still high likely at least in a short-term, so still suggest no to heavily bet on the long side.
2 reasons for expecting a short-term pullback:
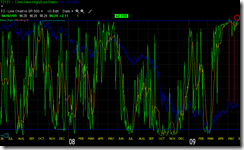
T2103 from Telechart, Zweig Breadth Thrust, the overbought on this chart is quite accurate.
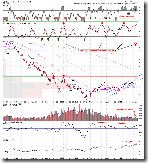
T2121 from Telechart, 13 Week New High/Low Ratio, the readings today is very extreme even in bull market.
6 not so good signs, they may or may not work though:
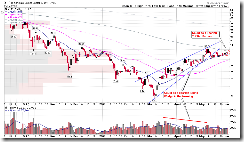
1.1.4 Nasdaq 100 Index Intermediate-term Trading Signals, price up 3 days in a row while volume down 3 days in a row, this kind of pattern usually leads a short-term pullback.
3.4.1 United States Oil Fund, LP (USO Daily), overbought, the same as above, price up 4 days in a row while volume down 4 days in a row, should pullback soon.
3.1.0 PowerShares DB US Dollar Index Bullish Fund (UUP Daily), oversold, should rebound soon. 3.1.1 PowerShares DB US Dollar Index Bullish Fund (UUP 30 min), oversold plus positive divergence, the reasons for a rebound is more clear on the 30 min chart. Since US dollar and the stock market are trending in opposite direction recently, so the rebound of the US dollar may mean a pullback in the stock market.
1.1.0 Nasdaq Composite (Daily), COMPQ rose today but SOX dropped big, this is not a good sign. Also there’re too many unfilled gaps on COMPQ daily chart.
5.3.0 Financials Select Sector SPDR (XLF Daily), financials were lagging recently, now a Bearish Tri Star pattern could be formed which means a further pullback.
From Seasonality, the following several days will not be so bull friendly.


8 Comments