Summary:
No conclusion, small body bar formed today could mean either a continuation or reversal.
US$ could pullback tomorrow.
Oil could rebound tomorrow.
| Trend | Momentum | Comments - Sample for using the trend table. | |
| Long-term | Up | ||
| Intermediate | Up | Neutral* | Further confirmation needed for the intermediate-term buy signals. |
| Short-term | Up | Neutral | |
| My Emotion | Up | Still think this is a bear market rally. |
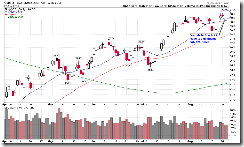
Small body bar again, so still no direction. Let’s see tomorrow. Just from my experiences, consolidation with a series of small bars usually breakout twice and the very first breakout could be a false one, so beware.
1.0.3 S&P 500 SPDRs (SPY 30 min), could be a Symmetrical Triangle, just statistically the upside breakout has only 54% chances so it virtually tells nothing about the future direction.
1.1.3 QQQQ Short-term Trading Signals, could be a Bearish Tri Star, just again statistically the downside breakout has only 52% chances so it too doesn’t tell us about the future direction.
As mentioned in the After Bell Quick Summary I bet a close green tomorrow because CPCI > 1.55. There’re 2 additional reasons though:
3.1.0 PowerShares DB US Dollar Index Bullish Fund (UUP Daily), black bar, so US$ could pullback which is good for the stock market.
3.4.1 United States Oil Fund, LP (USO Daily), hollow red bar, so oil could rise which also is good for the stock market.
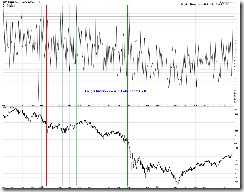
The char below is a longer history view of CPCI, as mentioned in the After Bell Quick Summary, I didn’t see any edges about what would happen next whenever CPCI > 2.0. Well, here’s the chart, see for yourself, maybe someone could deduce a formula out of this chart?


8 Comments