Summary:
Major intermediate trading signals are on the sell, but I'll give it another day.
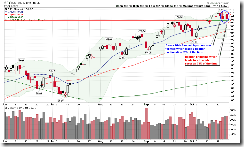
Bearish Engulfing and Stick Sandwich pattern on SPY daily chart looks bearish.
A quick look at my version of "Buying Climaxes" chart.
| TREND | MOMENTUM | EMOTION | COMMENT - Sample for using the trend table. | |
| Long-term | Up | Disbelieve | ||
| Intermediate | Up | Neutral | No argue | NYSI not confirming the up trend. |
| Short-term | *Down | Neutral | ||
| SPY SETUP | ENTRY DATE | INSTRUCTION | STOP LOSS | Mechanic trading signals for reference only. Back tested since 2002. |
| ST Model | 10/14 L | *Adjust Stop Loss | *10/13 Low | |
| Reversal Bar | Stopped out with gain on 10/21. | |||
| NYMO Sell | 10/21 S | 10/21 High |
*Improved setup, now the winning rate is 66% and the Gain/Loss Ratio is 4.5. Click the link to see more details.
|
|
|
|
||||
INTERMEDIATE-TERM: SOME SELL SIGNALS BUT I'LL WAIT FOR ANOTHER DAY
0.0.3 SPX Intermediate-term Trading Signals, sell yelled by MACD and NYSI plus lots of negative divergences, not good. But I’ll wait until Monday before downgrading the intermediate-term to down from up.
The bottom line: 1.2.1 Dow Theory: Averages Must Confirm, breadth extremely overbought and TRAN not confirming INDU's new high. I expect at least 10% correction.
SHORT-TERM: BEARISH ENGULFING AND STICK SANDWICH FORMED ON THE SPY DAILY CHART
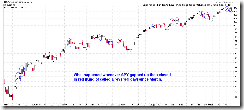
We had yet another reversal day on Friday (Open high but close in red. Yeah, yeah, I know how a “Key Reversal” day is defined, this just is my way of a reversal day. And by the way, statistically, a “Key Reversal” day actually doesn’t mean a reversal…). The chart below shows all the similar reversal days since March: The chances are good that SPY will consolidate then pullback. Therefore the short-term either we may see a few days consolidation or the consolidation was over, the pullback starts next week.
0.0.2 SPY Short-term Trading Signals, Bearish Engulfing and Stick Sandwich, looks bearish. As mentioned in the After Bell Quick Summary, the green line below is very important. See chart 1.0.3 S&P 500 SPDRs (SPY 30 min), if broken then a 1-2-3 formation will be formed with target at 105ish。Of course, bulls have their chances: a Symmetrical Triangle is in the forming. Anyway, I mean it’s too early to call who’s going to win now, let’s wait and see.
Take a look at the chart below: too many stocks in SPX reached Buying Climaxes this week (see red bars), not so good. By the way, this indicator is part of the Investors Intelligence paid services, I made it by myself according its definition and I’ll watch it from now on. Hopefully it could save you a few bucks.
Buying & Selling Climaxes
Investors Intelligence uses this term to describe a more specific event which occurs over a one week period.
- A buying climax is where a stock makes a new 52 week high but then closes below the previous week’s close.
- A selling climax is where a stock makes a new 52 week low and then closes above the previous week’s close.
The reason that we use such a rigid definition for climaxes is that this enables us to classify accurately and consistently what is and what isn’t a climax. This is important as we maintain historic records of the climaxes generated each week and have noted that important market turning points are often accompanied by a sudden rise in the number of buying or selling climaxes.
| A great example of this was in October 2002 when the Dow Industrials made its final low. At this point, our US Market Timing Service observed a massive increase in the number of US stocks generating selling climaxes. By communicating this to subscribers, we were able to provide a good early indication that a bounce was on the cards. |
INTERESTING CHARTS:
3.3.0 streetTRACKS Gold Trust Shares (GLD Daily), Ascending Triangle, so gold could rise further, May not be on Monday though.
3.4.2 United States Oil Fund, LP (USO 30 min), Descending Triangle, could be a short-term pullback.


