Summary:
The rebound was week, 3 up days in a row couldn't recover the previous 1 day loss, therefore it could be a sellable bounce.
| TREND | MOMENTUM | EMOTION | COMMENT - Sample for using the trend table. | |
| Long-term | Up | Disbelieve | ||
| Intermediate | Down | Neutral | ||
| Short-term | *Up | Neutral | Doubt | |
| SPY SETUP | ENTRY DATE | INSTRUCTION | STOP LOSS | Mechanic trading signals for reference only. Back tested since 2002. |
| ST Model | Short if 11/02 low is taken. | Officially in downtrend. | ||
| Reversal Bar | ||||
| NYMO Sell | 10/21 S | *Adjust Stop Loss | *11/04 High |
|
| VIX ENV | ||||
INTERMEDIATE-TERM: COULD BE A SELLABLE BOUNCE
Nothing new. The bear’s hope is 6.3.2b Major Distribution Day Watch, there could be the 3rd Major Distribution Day. The bull’s hope is 1.1.4 Nasdaq 100 Index Intermediate-term Trading Signals, lots of bottom signals.
All my 3 most recent reports have presented enough evidences for bulls to rally sharply but so far the bounce was weak. 7.1.0 Use n vs n Rule to Identify a Trend Change, up 3 days in a row couldn't recover the previous 1 day loss therefore it looks like a sellable bounce to me now.
Take a look at the “Indices Pair”, the leading indices still lag. (The huge rally in TRAN yesterday was due to Warren Buffett’s buyout, but today there’s no follow-through, so I cannot say TRAN is bullish.)
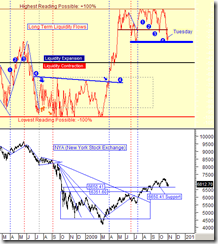
Fed. Liquidity and Foreign Liquidity Inflows from www.stocktiming.com, as we all know that the liquidity injected by Fed was the major force for the March rally. Now the liquidity dropped to a critical position, if it breakdown below the July low then bears will have yet another evidence (besides the weak rally) that indeed this time is different. I’ll keep you informed as soon as the liquidity chart breaks down.
SHORT-TERM: NO UPDATE
INTERESTING CHARTS: NONE


