Summary:
The market is building a top, not sure where exactly the top is though.
Expect short-term rebound, not sure though.
| TREND | MOMENTUM | EMOTION | COMMENT - Sample for using the trend table. | |
| Long-term | Up | Disbelieve | ||
| Intermediate | Down | Neutral | ||
| Short-term | Down | Neutral | ||
| SPY SETUP | ENTRY DATE | INSTRUCTION | STOP LOSS | Mechanic trading signals for reference only. Back tested since 2002. |
| ST Model |
*Long if green Monday. Again I have no confidence in this trade. |
*Stopped out long position with loss. No confidence in this trade.
|
||
| Reversal Bar |
*Long if green Monday. Again I have no confidence in this trade. |
*Stopped out long position with loss.
No confidence in this trade.
|
||
| NYMO Sell | 11/24 S | *Adjust Stop Loss | Breakeven |
|
| VIX ENV | ||||
| Patterns ect. |
INTERMEDIATE-TERM: BUILDING A TOP
The Dubai drama may mean nothing. But it could be seen as one of topping signs. I think I mentioned this sign before: False alarm before the market really tops – sudden drop followed by complete recovery as if nothing happened, this actually reflects the market’s nervousness. Another sign is up and down swings like what’s happening now. We all know that the up and down of the market actually reflects the supply and demand, if demand is high then there won’t be any up and down swing, the market simply goes straight up. Only when supply and demand reach equilibrium, will the market begin to show up and down swings. And since supply and demand are equal now, there’s a chance that the market will drop. The bottom line, I believe that the market is building a top, just I don’t know if the top was in already or there’s another new high.
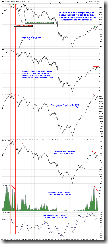
7.1.2 NYSE Advance-Decline Issues, lots of none confirmation.
7.1.1 Primay and Secondary Indices Divergence Watch, lots of none confirmation too.
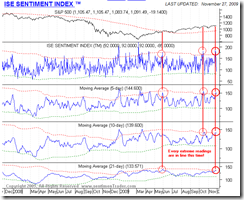
ISEE Index, unlike the previous 2 times, this time it has 4 red cycles so this could mean that the pullback could be larger than the previous 2 times.
Investor's Intelligence Sentiment Survey, too few bears among newsletter writers.
SHORT-TERM: COULD BE A REBOUND
There’re lots of reversal bars (hollow red or solid black) on many of daily charts, so the market could rebound on Monday. I’m not sure if those reversal bars formed simply because of the special holiday schedule though.
0.0.2 SPY Short-term Trading Signals.
2.0.0 Volatility Index (Daily).
3.1.0 PowerShares DB US Dollar Index Bullish Fund (UUP Daily). I think the black bar means a very short-term pullback, but because the ChiOsc is way too low now, on a little bit longer term, the dollar should rebound.
3.4.1 United States Oil Fund, LP (USO Daily).
INTERESTING CHARTS: NONE


