Summary:
May still have some up room but could be very close to a short-term top.
| TREND | MOMENTUM | EMOTION | COMMENT - Sample for using the trend table. | |
| Long-term | Up | Disbelieve | ||
| Intermediate | Down | Neutral | ||
| Short-term | *Up | Neutral | ||
| SPY SETUP | ENTRY DATE | INSTRUCTION | STOP LOSS | Mechanic trading signals for reference only. Back tested since 2002. |
| ST Model | 12/21 |
*Long intraday |
*12/18 Low | *No confidence in this trade. |
| Reversal Bar | 12/21 |
*Long intraday |
*12/18 Low |
*No confidence in this trade.
|
| NYMO Sell |
|
|||
| VIX ENV | ||||
NTERMEDIATE-TERM: BULLISH SEASONALITY BUT MARKET MAY NOT UP HUGE
Nothing new, very bullish seasonality, see 12/18/2009 Market Recap, but since the Options Speculation Index is way too bullish so I doubt how high the market could go.
0.0.9 Extreme Put Call Ratio Watch, this chart confirmed the extreme bullishness of the Options Speculation Index. Although it may only argue for a short-term top (see red dashed lines), but put it here could make my point more clear: OK to be bullish but proceed with caution. We believed a strong Thanksgiving yet it failed; We believed the last option expire week is bullish but it failed again; Now how about Santa Rally?
SHORT-TERM: COULD UP
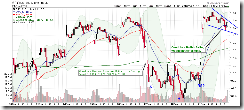
1.0.4 S&P 500 SPDRs (SPY 15 min), could be a Bullish Falling Wedge in the forming therefore the market could be up at least tomorrow morning.
1.0.2 S&P 500 SPDRs (SPY 60 min), looks bullish too on a little bit longer time frame, could be an Ascending Triangle in the forming. The only catch is that there’re too many unfilled gaps. Looks to me the SPY simply couldn’t hold its 14th gap recently. So if SPY gaps up again tomorrow morning but the gap is not large enough to break above the Ascending Triangle resistance line then chances are good that the gap will be filled and in this case be sure to check whether a Bearish Reversal day is formed.
INTERESTING CHARTS: NONE


