|
|||||||||||||||||||||||||
|
|||||||||||||||||||||||||
|
|||||||||||||||||||||||||
|
INTERMEDIATE-TERM: COULD BE BREAKOUT THEN PULLBACK BUT I SEE LOTS OF WARNINGS
The pullback before the Thursday close could be seen as a breakout then back test the breakout point therefore whether it means something or just an accident is remained to be seen.
From all the evidences I’ve gathered, I’m inclined to issue a warning for a possible intermediate-term trend change. Of course it doesn’t mean that you could short at will, in fact, it’s still far from a confirmed downtrend.
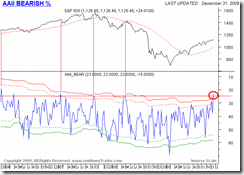
The latest II and AAII Survey both show extreme less bears kicking, especially II bears are the fewest ever.
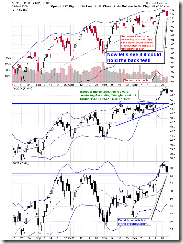
Climax Buying indicator, hope you still remember, I created for you for free. Take a look at the chart below, what happened whenever Climax Buying spiked (see red bar)?
8.1.0 Normalized NYTV, I know you’re so used to see the price climbing up on decreased volume. Well, this kind of scenario cannot last for ever, take a look at the red vertical lines below, it could be a payback time now.
Lots of cycle due. Most them looks like a top.
1.0.7 SPX Cycle Watch (Daily).
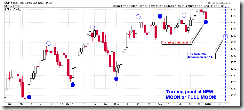
1.0.8 SPX Cycle Watch (Moon Phases). I know some of you may feel offended as “the Moon stuff” sounds superstitious. Well, I checked each Full Moon and New Moon, amazingly, they did tend to lead a reversal. Let’s just put this chart in my public chart list and watch for awhile, OK? Thanks for understanding.
4.1.9 SPX Cycle Watch (Weekly).
SHORT-TERM: COULD BE SMALL REBOUND FOLLOWED BY MORE PULLBACKS
Monday, there could be a rebound in the morning, the main reasons are that ChiOsc in chart 1.0.4 S&P 500 SPDRs (SPY 15 min) and 1.1.5 PowerShares QQQ Trust (QQQQ 30 min) are too low, plus, I think you all remember, once again it’s supposed to be a verli verli buuullliiissshhh Monday.
After the rebound, I expect more pullbacks, the main reason is chart 0.0.2 SPY Short-term Trading Signals, 4 bearish reversal bars in a row, should lead at least a few days pullback I think.
Other reasons for more pullback: Dollar could rise and oil could fall.
6.4.5 GLD and UUP Watch, amazing GLD black bar again, this usually means an UUP up day. It may also proves that the Bull Flag in chart 3.1.0 PowerShares DB US Dollar Index Bullish Fund (UUP Daily) is true.
3.4.0 United States Oil Fund, LP (USO Daily), black bar, so oil could pullback, besides the STO above is way too high.
INTERESTING CHARTS:
January Seasonality from www.sentimentrader.com.


