|
|||||||||||||||||||||||||
|
|||||||||||||||||||||||||
|
|||||||||||||||||||||||||
|
INTERMEDIATE-TERM: NO UPDATE
The chart below shows all the possible target according to the measured move pattern. SPX reached the most common target at Fib 61.8% today (Due to the limit of the Fib tool, in order to display the correct target price, I can only put the Fib tool upside down, anyway, treat Fib 38.2% as Fib 61.8%), so it’s possible that it could pullback tomorrow. The next target 1150 above is also very possible, see chart 4.1.0 S&P 500 Large Cap Index Weekly), there’re multiple resistances around there. Also according to Elliot Wave theory, if you still believe A = C, then the target is 1159 (see chart 4.1.9 SPX Cycle Watch (Weekly)) which also points to 1150 area. Coincidence? We’ll see.
SHORT-TERM: RUSSELL 2000 LOOKS WEAK
1.3.2 Russell 2000 iShares (IWM 30 min), could be a Head and Shoulders Top in the forming.
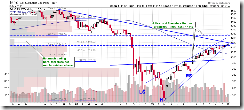
4.1.2 Russell 2000 iShares (IWM Weekly), the weekly chart clearly shows that IWM has multiple resistances above so again, IWM could pullback from here.
Nothing else new, no improvement on huge pile of short-term bearish signs, see trend table above. As mentioned in today’s After Bell Quick Summary, the market could pullback tomorrow, I’m not very sure though, but the the bottom line, I think a short-term pullback soon is very likely.
INTERESTING CHARTS: NONE


