TREND INDICATOR MOMENTUM INDICATOR COMMENT (Click link to see chart)
Long-term 3 of 3 are BUY    
Intermediate 3 of 3 are BUY

3 of 6 are OVERBOUGHT

SPY ST Model is in buy mode
Short-term 1 of 1 are SELL

6 of 6 are neutral

 
BULLISH 4.1.0 S&P 500 Large Cap Index (Weekly):  H&S Bottom text book target is 1246.
BEARISH

3.0.0 10Y T-Bill Yield: Top in a month?
8.1.0 Normalized NYTV: Topped?
4.0.4 Dow Theory: Averages Must Confirm: Multiple resistances and breadth very overbought.
1.0.2 S&P 500 SPDRs (SPY 60 min): 15 unfilled gaps. 
0.0.3 SPX Intermediate-term Trading Signals: CPC and CPCE MA10 are too low.
2.3.4 Nasdaq Total Volume/NYSE Total Volume: Topped?
01/14 Market Recap: II and AAII survey show extremely high bull to bear ratio.
0.0.8 SPX:CPCE: *Top signal confirmed.
01/15 Market Recap: Climax Buying?

CONCLUSION

All the intermediate trend signals are up so no doubt the trend is up. But the bearish signs presented above are enough to raise a caution flag, so it maybe prudent to reduce some long positions.

SPY SETUP ENTRY DATE STOP LOSS INSTRUCTION: Mechanic signals, back test is HERE, signals are HERE.)
TRADING VEHICLE:
SSO/SDS, UPRO/SPXU
ST Model 12/21 L *01/20 Low *Adjust stop loss.
Reversal Bar    

NYMO Sell


OTHER ETFs COMMENT – *New update, they may not be mentioned in the report. Click links to see more details.
IWM & QQQQ

8.2.9a QQQQ – 2009  - 8.2.9h QQQQ – 2002: Seasonality is bearish until the end of January.

EMERGING 1.4.0 Shanghai Stock Exchange Composite Index (Daily): *Big red bar means more downside ahead.
FINANCIALS 3.5.0 Financials Select Sector SPDR (XLF Daily): Could be a Bull Flag in the forming.
REITS
OIL & ENERGY
GOLD 3.3.0 streetTRACKS Gold Trust Shares (GLD Daily): *Lower high could be confirmed, looks bearish.
DOLLAR 3.1.0 PowerShares DB US Dollar Index Bullish Fund (UUP Daily): *Could be H&S Bottom in the forming.
BOND 3.0.0 10Y T-Bill Yield: Could be a Bull Flag. So yield could rise while bond should fall.

INTERMEDIATE-TERM: LITTLE CRACK ON SOX AND TRAN BUT OVERALL IS OK

No update, keep eye on 4.0.3 Primary and Secondary Indices Divergence Watch, a little bit non confirmation on SOX and TRAN but not big enough to be a concern.

SHORT-TERM: STILL WITHIN A RANGE BUT CPCE ARGUES FOR A TOP NOW

0.0.2 SPY Short-term Trading Signals, still is range bounded, the breakout direction is unknown. However, it certainly doesn’t feel good because all recent up days were on decreased volume while all down day on much more increased volume.

SPYShortTerm

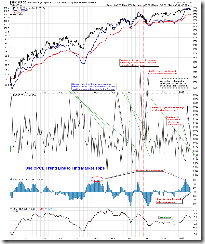
0.0.8 SPX:CPCE, trend line held for 2 days, a short-term top should be confirmed.

CPCE

1.0.7 SPX Cycle Watch (Daily), looks like a cycle top.

SPXDailyCycle

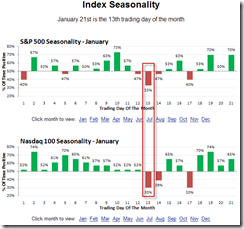
Besides, seasonality wise, tomorrow is the most bearish day in January, only 30% chances of a green close.

Seasonality

So the conclusion is maybe, possibly, could be, probably, more pullbacks ahead. I’m not sure.

INTERESTING CHARTS: NONE