TREND INDICATOR MOMENTUM INDICATOR COMMENT (Click link to see chart) Long-term 3 of 3 are BUY Intermediate 2 of 3 are SELL 4 of 6 are NEUTRAL SPY ST Model is in SELL mode Short-term 1 of 1 are SELL 7 of 8 are NEUTRAL
BULLISH 2.0.0 Volatility Index (Daily): Looks like VIX trend was reversed to down from up. BEARISH CONCLUSION
SPY SETUP ENTRY DATE STOP LOSS INSTRUCTION: Mechanic signals, back test is HERE, signals are HERE.
TRADING VEHICLE: SSO/SDS, UPRO/SPXUST Model 01/27 S *1.9xATR(10) *Click links above for ATR value. May not be a good timing to short here. Reversal Bar NYMO Sell 01/21 S Breakeven VIX MA ENV
INTERMEDIATE-TERM: THE CORRECTION TARGET FOR INDU COULD BE AROUND 9727
No update. According to chart 4.0.4 Dow Theory: Averages Must Confirm, the correction target could be around 9727.
SHORT-TERM: TWO CYCLES DUE, NEED SEE TOMORROW TO KNOW IF THEY MEAN TOP OR BOTTOM
Tomorrow is a key day because there’re cycle turn date due tomorrow and 01/30.
1.0.9 SPX Cycle Watch (60 min), I know most people don’t believe cycle, but this chart called the recent top successfully (see 01/20/2010 Market Recap), so it should have some credit now, shouldn’t it? According to the chart, if the market is up huge tomorrow morning then it could be a top while down huge means a bottom. This speculation is at least partially supported by today’s After Bell Quick Summary, as ChiOsc is way too high so it’s very likely a huge rise tomorrow morning, if any, could be faded.
1.0.8 SPX Cycle Watch (Moon Phases), so far moon phases worked OK, let’s just forget about being called superstitious, as long as it works, I’m OK with that. So combining with the 60 min cycle above, if the market is up huge tomorrow morning then it should reverse down intraday and fall until 01/29 or 02/01, while if the market is down huge tomorrow morning then it should reverse up and rise to 01/29 or 02/01.
Also there’re 3 additional reasons for calling a key day tomorrow:
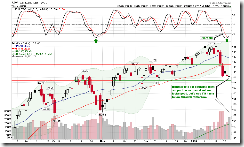
The candlestick pattern in chart 0.0.2 SPY Short-term Trading Signals and 1.3.0 Russell 2000 iShares (IWM Daily) look bullish but need a follow-through tomorrow to confirm the trend reversal.
I’ve been talking about VIX pattern for several days, so far correct for VIX only while the bounce of the SPX is a lot weaker than the previous 3 times, so SPX really need to prove itself tomorrow. We’ll see.
3.1.0 PowerShares DB US Dollar Index Bullish Fund (UUP Daily), looks like a Head and Shoulders Bottom breakout, if it could confirm the breakout tomorrow then it’ll be bad for the stock market especially for commodity and related stocks.
INTERESTING CHARTS: NONE


